Cost Audit FAQs
It enables unique identifying tags to be applied to items of accounting data. The tags provide a range of information about the item, such as whether it is a monetary item, percentage or fraction. XBRL not only allows labels in any language to be applied to items, it also allows the accounting references or other subsidiary information to be added to the tags.
With full adoption of XBRL, companies would be able to integrate its financial and cost data across its operational areas and exercise better control on its activities.
-
Costing Taxonomy -
http://www.mca.gov.in/Ministry/pdf/Costing_Taxonomy_2012-11-22_v1.0.zip Business Rules –
http://www.mca.gov.in/Ministry/pdf/Revised_Business_Rules_Updated_XBRL_Costing_29.11.2012.zip
a. Elements: This worksheet contains all the concepts that form the costing taxonomy. The concepts are defined as elements/tags along with their characteristics such as data type, balance type, Nillable etc. e.g. cost of sales of product or activity group is an element defined as:
Characteristic |
Property |
Meaning |
Element Name |
CostofSalesofProductorActivityGroup |
Name of the Element / Tag |
Preferred Label |
Cost of sales of product or activity group |
Label that would appear in the rendered report |
Label Role |
Standard label |
It is a standard label |
Abstract |
False |
Abstract is False implies element can be used to tag data. Abstract set to True indicates that the element is only used in a hierarchy to group related elements together and cannot be used to tag data in an instance document. |
Data Type |
Monetary Item Type |
It is monetary data type |
Balance Type |
Debit |
The balance is debit balance |
Period |
Duration |
The concept is reported for the period (financial year) |
Substitution Group |
Item |
This tells whether the element is item, tuple, hypercube or dimension. |
Nillable |
True |
Nillable set to true means the element can take empty values. If set to False it would means that the element in the instance should have non empty value. |
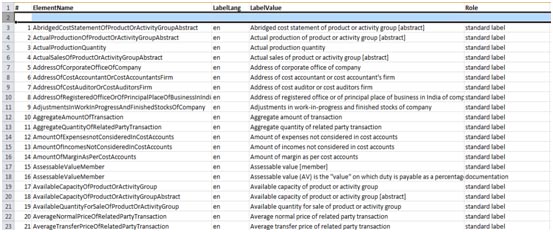
b. Labels: This worksheet contains the 491 nos. of labels to be used as preferred labels in the final presentation (rendering) of the report in human readable format. A screenshot of the labels is given below:
c. References: This worksheet contains the relationships between elements and the references of the elements defined by authoritative literature. The reference parts used are listed below:
Reference part |
Use |
Name |
CAS |
Publisher |
Institute of Cost Accountants of India |
Section |
Title of sections of standard or interpretation |
Paragraph |
Paragraph (number) in the standard |
Subparagraph |
Subparagraph (number) of a paragraph |

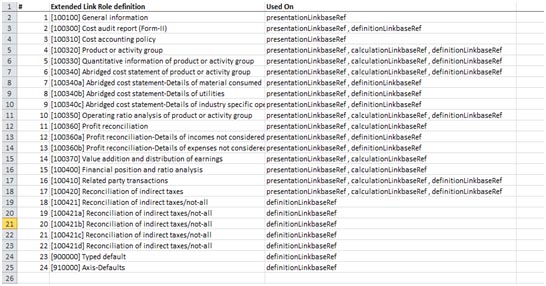
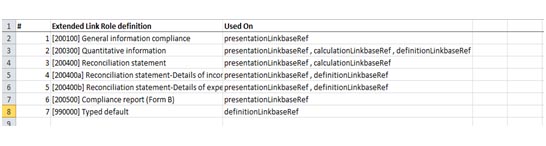
d. Extended Link Cost Audit Report: This worksheet contains the Extended Link Role definitions contained in the Cost Audit Report. Extended Link Roles represents a set of relationships between concepts and are the logical grouping of elements. The extended links are then used in link bases to build the relationships. The list of extended link roles in the Cost Audit Report are:
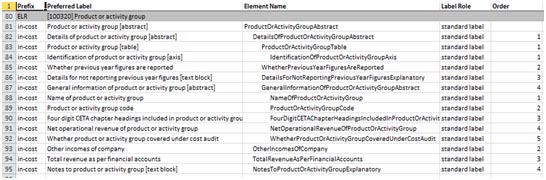
e. Presentation Cost Audit Report: This worksheet defines the structure of the Cost Audit Report for displaying the data along with preferred label attribute and the specific order in which they appear. This enables the taxonomy users to view the representation of elements in the human readable format. The illustration below shows the presentation of Product or Activity Group Details (Para 3 of the Annexure to Cost Audit Report):
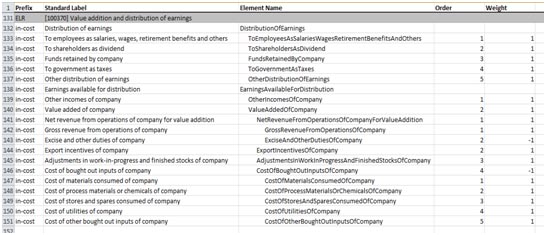
f. Calculation Cost Audit Report: This worksheet contains the Additive relationships between numeric items expressed as parent-child hierarchies in the Cost Audit Report. Each calculation child has a weight attribute (+1 or -1) based upon the natural balance of the parent and child items. Illustration below represents the calculation view of the Value addition and distribution of earnings of the Annexure to Cost Audit Report (Para 8):
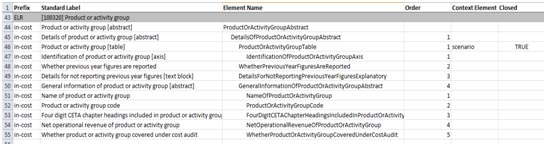
g. Definition Cost Audit Report: It is used to express the dimensional relationship between elements of the Costing Taxonomy for the Cost Audit Report. An illustration of the definition linkbase for the Cost Audit Report showing elements of the Product or Activity Group Details is given below:
h. Extended Link Compliance Report: This worksheet contain the Extended Link Role definitions contained in the Compliance Report. Extended Link Roles represents a set of relationships between concepts and are the logical grouping of elements. The extended links are then used in link bases to build the relationships. The list of extended link roles in the Compliance Report are:
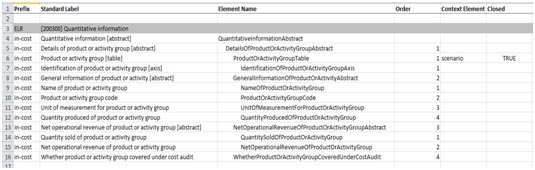
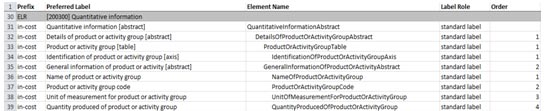
i. Presentation Compliance: This worksheet defines the structure of the Compliance Report for displaying the data along with preferred label attribute and the specific order in which they appear. This enables the taxonomy users to view the representation of elements in the human readable format. The illustration below shows the presentation of Quantitative Information (Para 2 of the Annexure to Compliance Report):
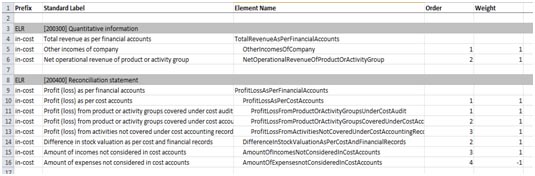
j. Calculation Compliance Report: This worksheet contains the Additive relationships between numeric items expressed as parent-child hierarchies in the Compliance Report. Each calculation child has a weight attribute (+1 or -1) based upon the natural balance of the parent and child items. Illustration below represents the calculation view of the Quantitative Information and Reconciliation Statement of the Annexure to Compliance report:
k. Definition Compliance Report: It is used to express the dimensional relationship between elements of the Costing Taxonomy for the Cost Audit Report. An illustration of the definition linkbase for the Compliance Report showing elements of the Quantitative Information (Para 2) is given below: